---
title: "How to Read the Error Logs of Your Website on Plesk"
description: "Find the cause of a 500 error or a blank page in your website logs on Winheberg Plesk web hosting, filters, real-time tracking and common PHP messages."
category: cloud
subcategory: hebergement-web
icon: tabler:file-text
date: 2026-11-02
author: Winheberg
slug: "website-error-logs-plesk"
order: 147
image: /statics/images/docs/en/hebergement-web/website-error-logs-plesk.webp
tags: [Logs, 500 Error, PHP, Plesk, Web Hosting]
keywords: [500 error, blank page, error logs, plesk error_log, php logs, website debugging]
link_fr: "/docs/hebergement-web/journaux-erreurs-site-plesk"
---
## Context
A 500 error, a blank page or a form that no longer sends almost always has a cause written in plain text in the server logs. Reading them is the first reflex before changing anything.
On your [Winheberg web hosting](https://winheberg.com/en/cloud/web-hosting), Plesk gathers the logs of each domain on a single page, with filters by type, date and keyword, and real-time tracking.
This guide shows you how to open these logs, find the right line and interpret the most frequent messages.
> [!NOTE]
> The Winheberg Plesk panel is displayed in French. Menu, field and button names are quoted below exactly as they appear on screen, followed by their English meaning.
## Prerequisites
- A Winheberg web hosting plan with access to the Plesk panel
- The approximate time the error occurred
## 1. Open the domain logs
In **Sites Web & Domaines** (*Websites & Domains*), open your domain. In the **Tableau de bord** (*Dashboard*), **Outils Dévelop.** (*Dev Tools*) section, click **Journaux** (*Logs*).
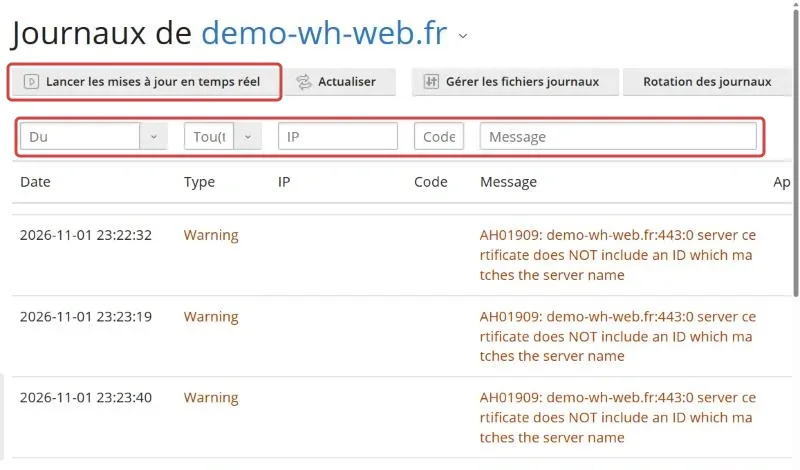 Each line shows the **Date**, the **Type**, the visitor **IP**, the response **Code**, the **Message** and the **Source**, meaning the original log.
## 2. Choose the logs to display
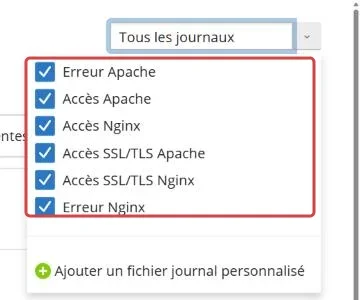
At the top right, the **Tous les journaux** (*All logs*) list lets you tick the logs to display.
 ::MdTable{caption="Available logs" variant="info" striped}
| Log | What it contains |
|---|---|
| Erreur Apache (*Apache error*) | Web server and PHP errors, the most useful for a 500 error |
| Accès Apache (*Apache access*) | Every page requested over HTTP, with its response code |
| Accès SSL/TLS Apache (*Apache SSL/TLS access*) | Every page requested over HTTPS |
| Erreur Nginx (*Nginx error*) | Errors of the front-end server, useful when **Erreur Apache** shows nothing |
| Accès Nginx and Accès SSL/TLS Nginx (*Nginx access*) | Requested pages, as seen by the front-end server |
::
## 3. Find the right line
For a 500 error, keep only the error logs ticked, then choose the **error** type in the list under the toolbar and the period when the error occurred.
The **IP**, **Code** and **Message** fields filter on a keyword. Enter `500` in **Code**, for instance, or a file name in **Message**, then click **Appliquer** (*Apply*).
> [!TIP]
> Click **Lancer les mises à jour en temps réel** (*Start real-time updates*), then reproduce the error in another tab. The matching line shows up right away, with no searching.
## 4. Interpret frequent messages
::MdTable{caption="Common messages and leads" variant="info" striped footer="Values in brackets depend on your website."}
| Message | Likely cause |
|---|---|
| `PHP Fatal error: Allowed memory size of [N] bytes exhausted` | The script exceeded the allowed memory, raise `memory_limit` in **Paramètres PHP** (*PHP Settings*) |
| `PHP Fatal error: Maximum execution time of [N] seconds exceeded` | The script ran too long, raise `max_execution_time` in **Paramètres PHP** |
| `PHP Fatal error: Uncaught Error: Call to undefined function` | A function does not exist in the PHP version in use, check the version your application requires |
| `PHP Parse error: syntax error` | A syntax error in a PHP file, the path and line are given in the message |
| `AH01630: client denied by server configuration` | A rule of an `.htaccess` file blocks access |
::
The file path quoted in the message points you to the culprit, for instance a WordPress plugin in `wp-content/plugins/`.
## 5. Read your application logs
Some applications write their errors to their own files, on top of the server logs.
- WordPress writes to `wp-content/debug.log` when the logging of its debug mode is on, set from the settings icon next to **Débogage** (*Debugging*) on the website card, see our guide [How to Host a WordPress Website on Plesk](https://winheberg.com/en/docs/hebergement-web/host-wordpress-plesk)
- Laravel writes to `storage/logs/laravel.log`, see our guide [How to Host a Laravel Website on Plesk](https://winheberg.com/en/docs/hebergement-web/host-laravel-plesk)
The raw server log files sit in the `logs` folder of your webspace, reachable from **Gérer les fichiers journaux** (*Manage log files*).
## Troubleshooting
### ❌ The error log stays empty
The error is not recorded where you are looking.
- Tick all the logs again, **Erreur Nginx** in particular, and remove the type filter
- Check that the chosen period includes the time of the error
- If the application shows its own errors, read its file as described in step 5
### ❌ Too many lines to find your way
Normal visits drown out the useful lines.
- Filter on the **error** type and on the date
- Use real-time tracking while reproducing the error
- Enter your own IP address in the **IP** field to only see your tests
## Best practices
- Note the exact time of an error before investigating, the search will be much faster
- Read the logs again after each significant update of your website
- Turn off your application debug mode once the problem is solved
- A burst of access lines to the same unknown page may point to an attack, see our guide [What to Do If Your Website Is Hacked on Plesk](https://winheberg.com/en/docs/hebergement-web/hacked-website-plesk)
## Need help?
If the message remains unclear, open a ticket with our support from your [client area](https://billing.winheberg.com), **Technical** department, filling in the **Related Product** field with the web hosting concerned. Copy the full log line and the time of the error, our team will know where to look.
Your website finally tells you what is wrong 🔍