Context
We're often asked how much of a real performance difference there is between a Ryzen 9 9950X and a Xeon Gold 6154 processor for running a Minecraft Bedrock server. Rather than relying on spec sheets, we ran a real benchmark under near-real conditions, with simulated players mining, moving around, and chatting, on a PowerNukkitX server.
This comparison shows the raw results for both configurations, TPS, CPU load, memory, and the ability to handle a progressive ramp-up in load.
Methodology
The test connects bots simulating players in successive waves, with basic AI (movement, mining, chatting, reconnecting after death) to get closer to real usage rather than a simple passive connection.
Test dates: July 30, 2026 (both tests)
Benchmark run by: Gabriel Captari (senseitarzan)
Server tested: PowerNukkitX 3.0.1-SNAPSHOT (git-bc3f83b, API 3.0.1), Minecraft Bedrock 1.26.30 used on both tests
Load profile: 16 waves of 16 bots, 15 seconds apart
Bots with AI: up to 256 bots active at once (movement, mining, chat, respawn after death)
Measurements:
/statusreadings every 5 seconds (TPS, CPU, memory, players, entities, chunks)Reset between each test: deleting the
dbfolder to start over on an empty map (same seed and generation settings) and deleting theplayersfolder, so each run starts under identical conditionsAllocated resources: 6 vCPU and 8 GB of RAM for each of the two configurations tested
This test was run with 6 vCPU allocated. A plan with more vCPU would handle more simultaneous players, the numbers in this guide reflect this specific configuration, not the maximum ceiling of each processor.
Bot behavior (movement, mining, chatting) has a random component. From one run to the next, the bots' exact actions aren't perfectly identical, even starting from the same map and seed. The results should be read as representative of a comparable load profile, not as a block-for-block identical reproduction between the two tests.
These results are specific to PowerNukkitX. Other Bedrock server software, like Altay, has different behavior and optimization and may take advantage of a Ryzen even more. Don't apply these numbers to another server software without testing it yourself.
Results, Ryzen 9 9950X
TPS stability and incidents
- 90 connection failures out of 256 bots launched, about 35% failure, almost all of the "closed before spawn" type (85), with a few cases of "connection timeout exceeded" (5), the bot's socket closes before finishing its connection to the server, usually because the bench tool hits its own connection limit at the same time, before the server could process every attempt
- 2 out of 77
/statusreadings with no usable response (3%), the phases involved have no measurement - 166 bots stayed connected at once at most
- Idle tick load: 5.6%, even before the first bot connects
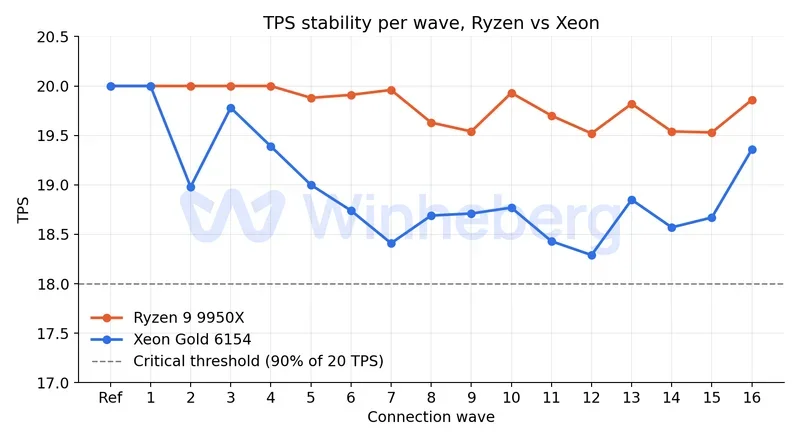
The lowest TPS observed drops to 18.16, a 9.2% drop from the baseline. No drop below the critical 90% of baseline threshold was seen on this profile.
The chart below shows how TPS evolves wave after wave for both configurations.
We can also look at that same TPS not by wave, but directly as a function of the number of connected players, which gives a slightly different read.
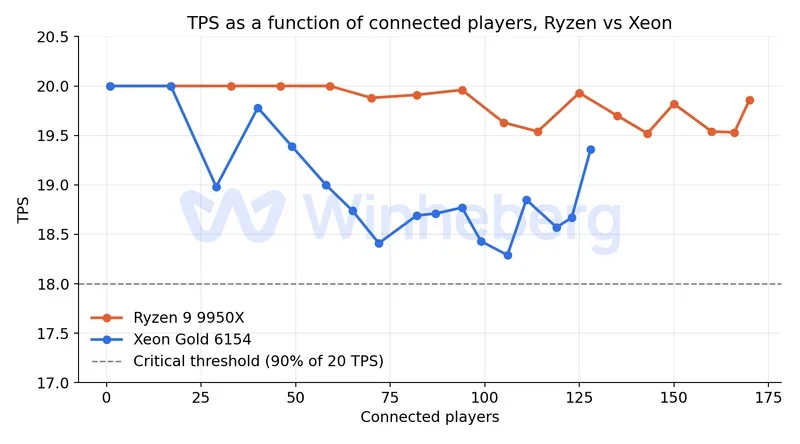
The gap between the two configurations shows up even more clearly this way, the Xeon starts losing TPS at around thirty players, while the Ryzen stays nearly perfect well beyond that.
Connection waves
| Wave | Launched | Connected | Failures | Cumulative connected |
|---|---|---|---|---|
| 1 | 16 | 16 | 0 | 16 |
| 2 | 16 | 16 | 0 | 32 |
| 3 | 16 | 13 | 3 | 45 |
| 4 | 16 | 13 | 3 | 58 |
| 5 | 16 | 11 | 5 | 69 |
| 6 | 16 | 12 | 4 | 81 |
| 7 | 16 | 12 | 4 | 93 |
| 8 | 16 | 11 | 5 | 104 |
| 9 | 16 | 9 | 7 | 113 |
| 10 | 16 | 11 | 5 | 124 |
| 11 | 16 | 10 | 6 | 134 |
| 12 | 16 | 8 | 8 | 142 |
| 13 | 16 | 7 | 9 | 149 |
| 14 | 16 | 8 | 8 | 159 |
| 15 | 16 | 3 | 13 | 163 |
| 16 | 16 | 6 | 10 | 166 |
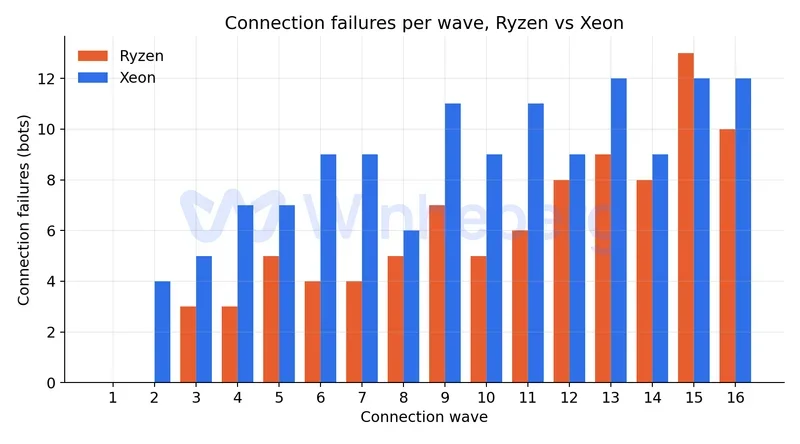
The first two waves go through with no failures at all, then failures show up starting at wave 3 and continue through the rest of the test, peaking at 13 failures on wave 15. The chart below compares this failure pattern to the Xeon's, wave by wave.
Ramp-up
| Phase | Players | TPS | Average CPU | Peak memory | Max entities |
|---|---|---|---|---|---|
| Baseline | 1 | 20 | 43% | 1382 MB | 28 |
| Wave 1 | 17 | 20 | 95% | 1466 MB | 56 |
| Wave 2 | 33 | 20 | 166% | 1748 MB | 104 |
| Wave 3 | 46 | 20 | 215% | 1258 MB | 168 |
| Wave 4 | 59 | 20 | 257% | 1268 MB | 219 |
| Wave 5 | 70 | 19.88 | 256% | 1552 MB | 252 |
| Wave 6 | 82 | 19.91 | 290% | 1538 MB | 297 |
| Wave 7 | 94 | 19.96 | 341% | 1838 MB | 342 |
| Wave 8 | 105 | 19.63 | 360% | 1640 MB | 407 |
| Wave 9 | 114 | 19.54 | 398% | 1490 MB | 494 |
| Wave 10 | 125 | 19.93 | 391% | 1918 MB | 570 |
| Wave 11 | 135 | 19.7 | 467% | 1416 MB | 609 |
| Wave 12 | 143 | 19.52 | 470% | 1314 MB | 648 |
| Wave 13 | 150 | 19.82 | 339% | 1694 MB | 623 |
| Wave 14 | 160 | 19.54 | 496% | 1836 MB | 625 |
| Wave 15 | 166 | 19.53 | 500% | 1678 MB | 635 |
| Wave 16 | 170 | 19.86 | 227% | 1642 MB | 694 |
| Plateau | 167 | 19.97 | 316% | 1872 MB | 688 |
| Recovery | 167 | 19.85 | 183% | 1746 MB | 686 |
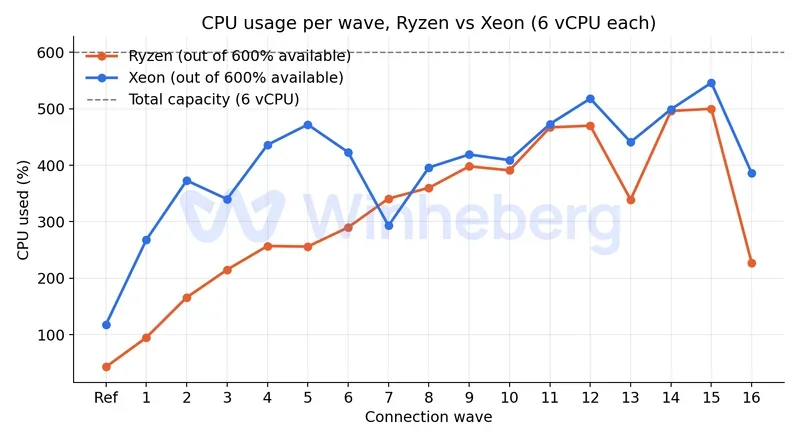
CPU is expressed on the scale of the 6 vCPU allocated for this test (100% = 1 vCPU, 600% = total capacity).
Results, Xeon Gold 6154
TPS stability and incidents
This test ran into several incidents that the Ryzen run didn't have.
- 132 connection failures out of 256 bots launched (sockets closed before spawn for 127, connection timeout exceeded for 5), a 52% failure rate
- 2 out of 77
/statusreadings with no usable response (3%), the phases involved have no measurement - Only 126 bots stayed connected at once at most, versus 166 on the Ryzen test (see above)
- Idle tick load: 100%, an oddly high number for a server with no bot connected, already seen on a previous Xeon test, likely tied to the test machine rather than the software itself
The lowest TPS observed drops to 17.1, a 14.5% drop from the baseline. The first drop below the critical 90% of baseline threshold shows up as early as wave 11, with around 98 bots connected.
Connection waves
| Wave | Launched | Connected | Failures | Cumulative connected |
|---|---|---|---|---|
| 1 | 16 | 16 | 0 | 16 |
| 2 | 16 | 12 | 4 | 28 |
| 3 | 16 | 11 | 5 | 39 |
| 4 | 16 | 9 | 7 | 48 |
| 5 | 16 | 9 | 7 | 57 |
| 6 | 16 | 7 | 9 | 64 |
| 7 | 16 | 7 | 9 | 71 |
| 8 | 16 | 10 | 6 | 81 |
| 9 | 16 | 5 | 11 | 86 |
| 10 | 16 | 7 | 9 | 93 |
| 11 | 16 | 5 | 11 | 98 |
| 12 | 16 | 7 | 9 | 105 |
| 13 | 16 | 4 | 12 | 110 |
| 14 | 16 | 7 | 9 | 117 |
| 15 | 16 | 4 | 12 | 121 |
| 16 | 16 | 4 | 12 | 126 |
Failures show up as early as wave 2 and stay at a high rate for the rest of the test, peaking at 12 failures on waves 13, 15, and 16.
Ramp-up
| Phase | Players | TPS | Average CPU | Peak memory | Max entities |
|---|---|---|---|---|---|
| Baseline | 1 | 20 | 118% | 1398 MB | 31 |
| Wave 1 | 17 | 20 | 268% | 1754 MB | 50 |
| Wave 2 | 29 | 18.98 | 373% | 1520 MB | 83 |
| Wave 3 | 40 | 19.78 | 340% | 1260 MB | 147 |
| Wave 4 | 49 | 19.39 | 436% | 1386 MB | 225 |
| Wave 5 | 58 | 19 | 472% | 1292 MB | 276 |
| Wave 6 | 65 | 18.74 | 423% | 1616 MB | 342 |
| Wave 7 | 72 | 18.41 | 293% | 1388 MB | 382 |
| Wave 8 | 82 | 18.69 | 396% | 1298 MB | 442 |
| Wave 9 | 87 | 18.71 | 419% | 1216 MB | 474 |
| Wave 10 | 94 | 18.77 | 409% | 1174 MB | 503 |
| Wave 11 | 99 | 18.43 | 473% | 1462 MB | 535 |
| Wave 12 | 106 | 18.29 | 518% | 1682 MB | 543 |
| Wave 13 | 111 | 18.85 | 441% | 1444 MB | 562 |
| Wave 14 | 119 | 18.57 | 499% | 1336 MB | 570 |
| Wave 15 | 123 | 18.67 | 546% | 2152 MB | 606 |
| Wave 16 | 128 | 19.36 | 386% | 1804 MB | 614 |
| Plateau | 127 | 18.47 | 493% | 1634 MB | 611 |
| Recovery | 125 | 19.87 | 243% | 1650 MB | 616 |
CPU is expressed on the scale of the 6 vCPU allocated for this test (100% = 1 vCPU, 600% = total capacity).
Comparison
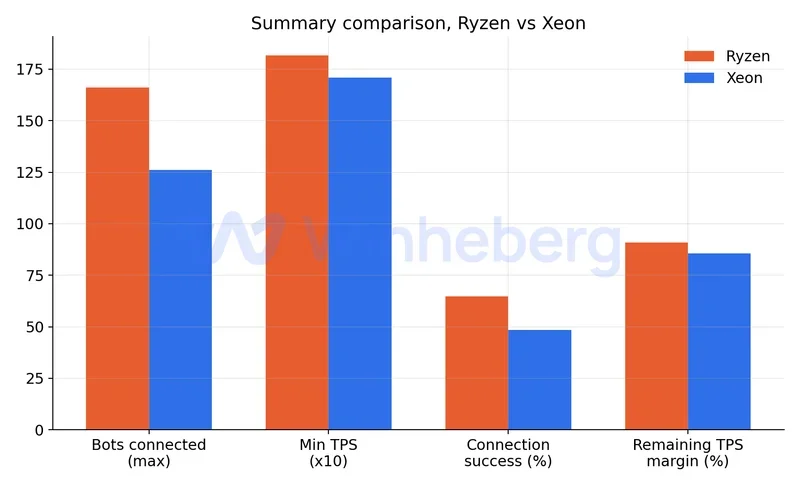
The chart below visually summarizes the key metrics for both configurations, before the detailed numbers in the table that follows.
| Metric | Ryzen 9 9950X | Xeon Gold 6154 |
|---|---|---|
| Connected bots (max simultaneous) | 166 | 126 |
| Connection failures | 90 (35%) | 132 (52%) |
| Idle tick load (before bots connect) | 5.6% | 100% (likely issue, see above) |
| Lowest TPS observed | 18.16 | 17.1 |
| Maximum TPS drop | 9.2% | 14.5% |
| First drop below 90% of baseline | None on this profile | Wave 11 (~98 bots) |
| Peak CPU (share of total allocated capacity) | around 500% out of 600% (~83%) | around 546% out of 600% (~91%) |
| Slowest typical connection time (p95) | 7336 ms (wave 14) | 6222 ms (wave 10) |
| Bot deaths followed by a respawn | 20 | 17 |
"p95" means 95% of bots connected faster than this figure, only the slowest 5% took longer. It's a way to measure the common worst case without being thrown off by one or two exceptionally slow bots.
On this load profile, the Ryzen test held a noticeably higher number of connected bots (166 versus 126), with a lower connection failure rate (35% versus 52%) and a TPS that never dropped below the critical 90% of baseline threshold, unlike the Xeon, whose TPS drops too much as early as wave 11, with only around a hundred bots connected.
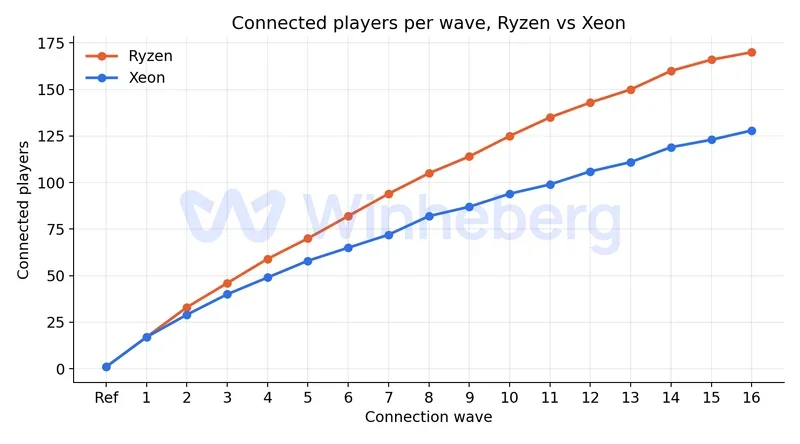
The gap widens wave after wave, the Ryzen consistently accepts more connections at every step, a gap that builds up over the course of the test rather than closing back up.
CPU load follows a similar trajectory, but with a consistent gap in the Ryzen's favor for almost the entire test.
Now let's look at memory, with the same type of chart.
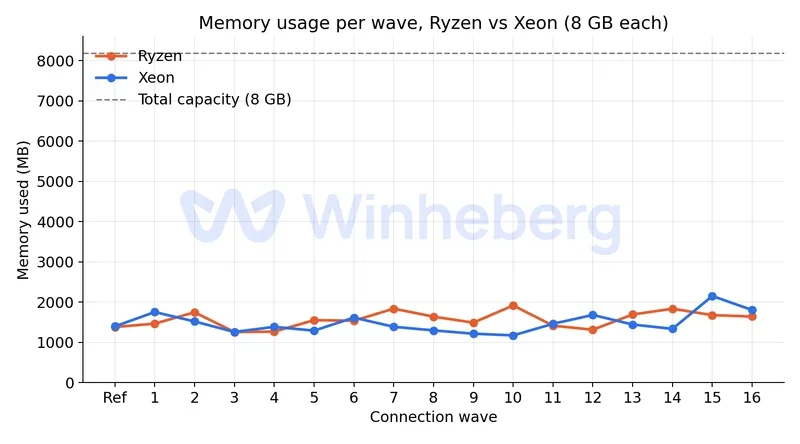
On memory, both configurations stay well below their 8 GB ceiling throughout the test, so RAM isn't the limiting factor on this load profile, unlike CPU, which gets noticeably closer to its total capacity, especially on the Xeon side.
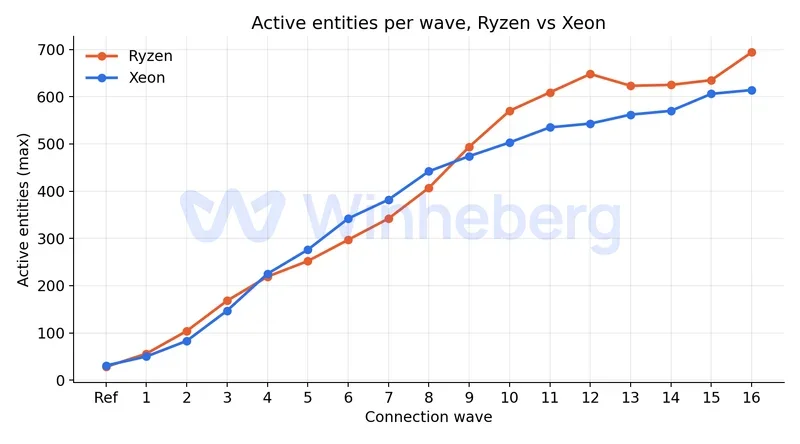
The number of active entities (players, objects, mobs tracked by the server) grows in a comparable way on both configurations, with no notable gap, which confirms that the performance difference really does come from the processor rather than a different load profile between the two tests.
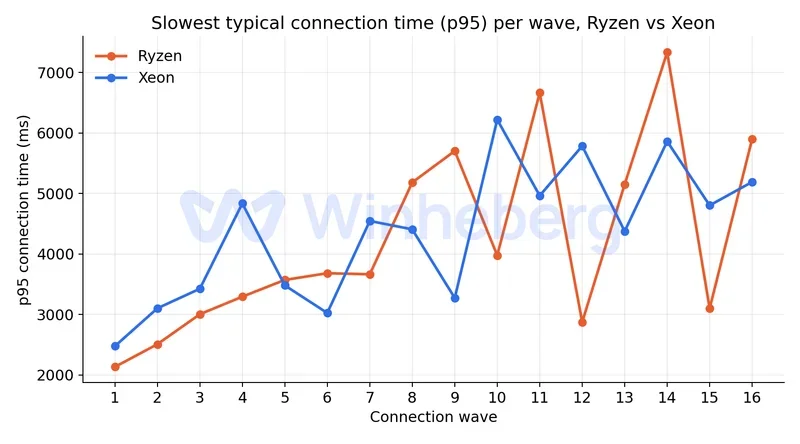
On this run, the slowest connection times for both tests are close, with a slightly better score for the Xeon (6222 ms versus 7336 ms), a result that contrasts with previous runs where the Xeon was always the slowest.
Both tests ran on the same allocation of 6 vCPU and 8 GB of RAM, so the comparison is at equal resources. Neither run hit any test workers dropping this time, but the Xeon test shows an abnormally high idle tick load (100%), already seen on a previous Xeon test, which keeps coming back on this test machine, so it doesn't look like an isolated incident.
The gap seen in connection failure rate, the number of bots held, and the point where TPS drops too much stays clearly in the Ryzen's favor.
Conclusion
On this PowerNukkitX benchmark with a progressive ramp-up to around 250 simulated bots, the Ryzen 9 9950X showed better stability than the Xeon Gold 6154, a TPS that stayed above the critical threshold throughout, a lower connection failure rate, and more simulated players held at once before TPS dropped too much. The Xeon remains a viable option for more modest loads, but starts dropping off noticeably earlier as load increases.
These results reflect a specific test profile (16 waves of 16 bots with active AI) with the same resources allocated on both tests (6 vCPU and 8 GB of RAM each). If your project has very high load needs, the Ryzen 9 9950X is the safer choice based on these measurements.